Read with Claude
 Read with ChatGPT
Physics prof. and equations
When you open a document, it is easy to feel like you are drowning in words before you even find the point. Sometimes, the author cuts right to the chase and lays out the structure of the document well with headings and sub-headings. At others, you have to wade your way through words, just like you are doing right now to get to the point.
That is where flowcharts help. We can create a flow of the entire document that can be easily read and parsed for a quick understanding. While the traditional process did involve reading the document and breaking down steps for the flowchart, we are, of course, going to leverage AI and automate this process.
In this article, we are going to setup the draw.io MCP and connect it to antigravity to help us parse documents and generate flowcharts.
Why Flowcharts Work
A good flowchart does more than list steps. Instead of guessing where to start they see the first node and the next logical move at the same glance. That saves everyone missing the point when they skim over the document.
This works for almost any kind of document and process flow. Whether you are onboarding a new hire, laying out a deployment pipeline, or mapping a customer journey, the visual shape makes the invisible steps visible.
Here are some of the use cases where I have found flowcharts help me visualize the flow:
- Customer onboarding
- Service deployment pipeline
- API sequence for a checkout
- Product-Market Fit analysis
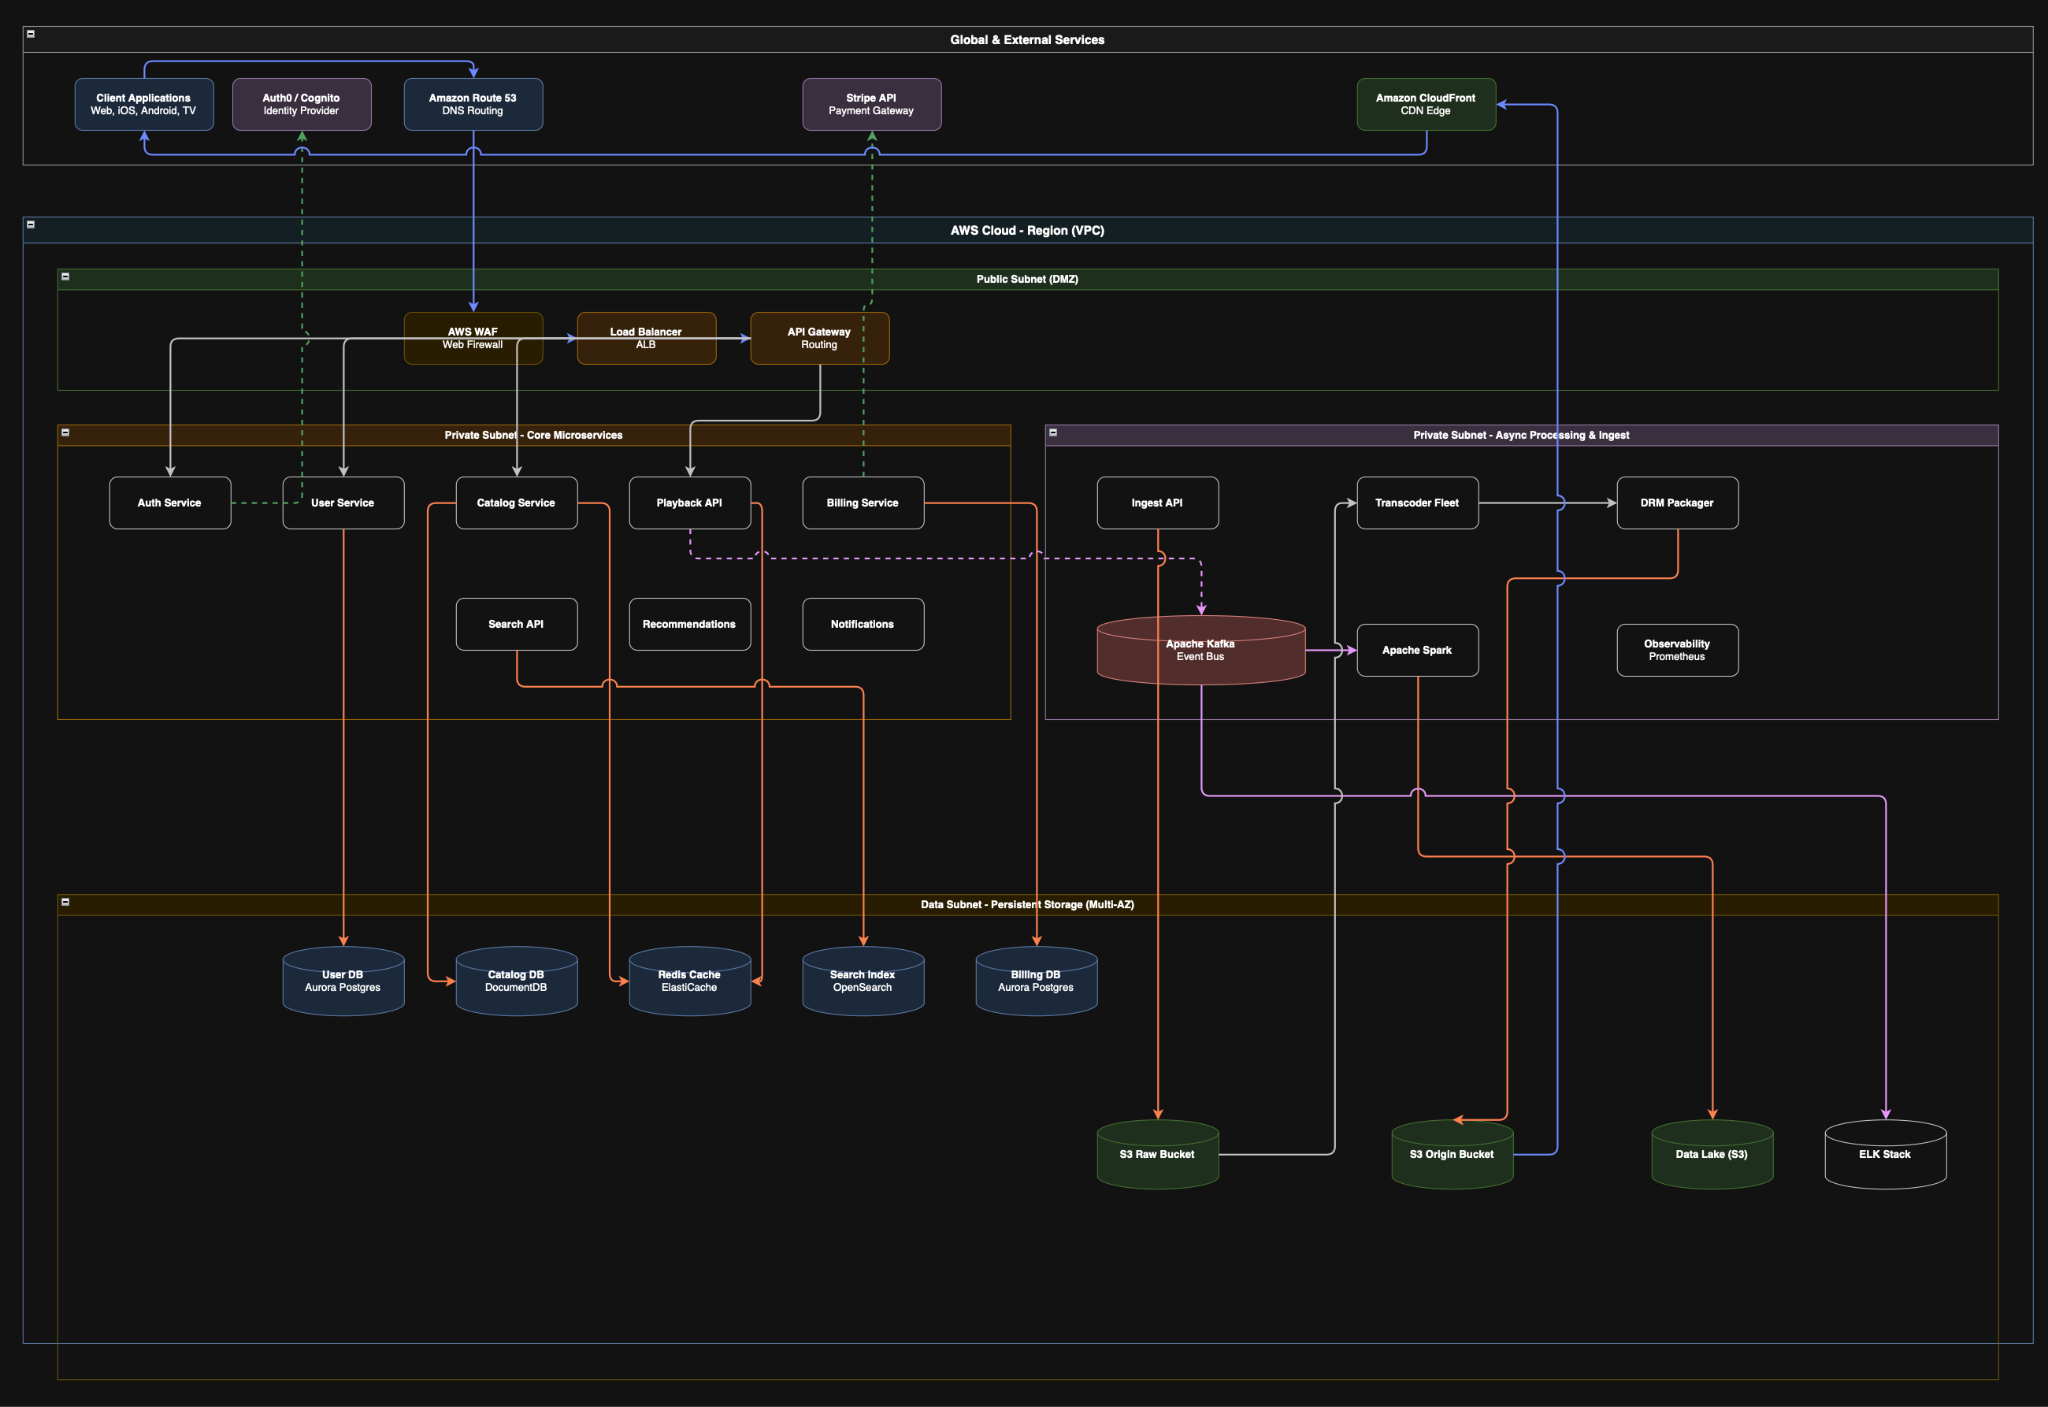
Setting Up the Draw.io MCP Server in Google Antigravity
Let us get started by setting up the draw.io MCP server in Google Antigravity. Feel free to use the IDE of your choice (VS Code, Cursor, Devin Desktop, etc.) and follow the process to setup the MCP.
- Install Node.js: Ensure you have Node.js version 18.0.0 or higher installed from the official Node.js website.
- Install Antigravity: Download and install Google Antigravity IDE from
antigravity.google/downloadand sign in. - (Optional) Install VS Code Extension: If you want to view downloaded
.drawiofiles locally, install the official draw.io extension within Antigravity. - Configuring the MCP Server: Open the Antigravity chat interface, click the three dots, and navigate to MCP Servers -> Manage MCP Servers -> View raw config.
- Paste the following exact configuration snippet.
{
  "mcpServers": {
    "drawio": {
      "command": "npx",
      "args": [
        "-y",
        "@drawio/mcp"
      ]
    }
  }
}
Restart Antigravity to apply the configuration. Confirm that the drawio server appears as connected in the MCP panel.
Prompting Draw.io to Generate Flowcharts
Prompting works best when you treat the chart like a story you’re asking the AI to illustrate. Start with a plain English paragraph that describes the process, then ask Draw.io to turn that paragraph into a flowchart.
- Open an agent chat in Antigravity. Select Planning mode for complex architectural diagrams or Fast mode for simple flowcharts.
- Write a natural language prompt specifying the diagram type, key elements, and relationships. (Tip: You can explicitly tell the agent, “Use the draw.io MCP tool to create this diagram.”)
- The agent will generate the diagram logic (using XML, CSV, or Mermaid.js under the hood) and provide you with a clickable link.
- Click the link to open the fully editable diagram directly in the draw.io interface, where you can tweak labels, colors, or export the final file
Tips for Better Prompts
- Specify the diagram type explicitly in the prompt to ensure the agent understands the goal.
- Mention the draw.io MCP tool by name so the agent uses the correct tool for editable output.
- Provide a short narrative of the process before asking for the diagram to give the agent context.
- Specify shape libraries and icon sizes to avoid distorted or inconsistent elements.
- Use Planning mode for diagrams with more than ten nodes and Fast mode for simple ones.
- Review the diagram for missing edge cases because the AI generates most of it correctly.
Example Prompt: Product-Market Fit Analysis
Turn this plain English description into a colorful, detailed flowchart in draw.io.
A party app connects people with shared interests. The story flows in six stages: it starts with the Problem — people struggle to find others who share their vibe at social events. That problem points to four Customer Segments — Gamers, Music fans, Foodies, and Fitness communities, each with a pain point label. Those segments feed into a Value Proposition block shaped like two boxes meeting in the middle — left side lists what customers need, right side lists what the app offers, and the overlap is labeled “FIT” in gold. Below that, show the Market Size as three nested triangles labeled TAM, SAM, and SOM with dollar values shrinking top to bottom. Next to it place a 2x2 Competition Matrix with axes labeled “Generic vs Interest-Specific” and “Planned vs Spontaneous” — plot Meetup, Facebook Events, Bumble BFF, and Discord, then mark our app with a gold star in the bottom-right corner. End with a full-width row of six PMF Metric cards across the bottom, one for each signal: Retention, Must-Have Score, Viral Coefficient, Activation Time, NPS, and Monthly Growth.
Connect each stage with a labeled arrow showing how one leads to the next. Add a single curved dotted arrow going from the Metrics block back to the Problem block and label it “Feedback Loop.” Use a different bold color for each section header. Keep the canvas background off-white. Label every node with its exact name and value so nothing needs guessing. Do not add extra branches or edge cases — show only the main path between the six stages..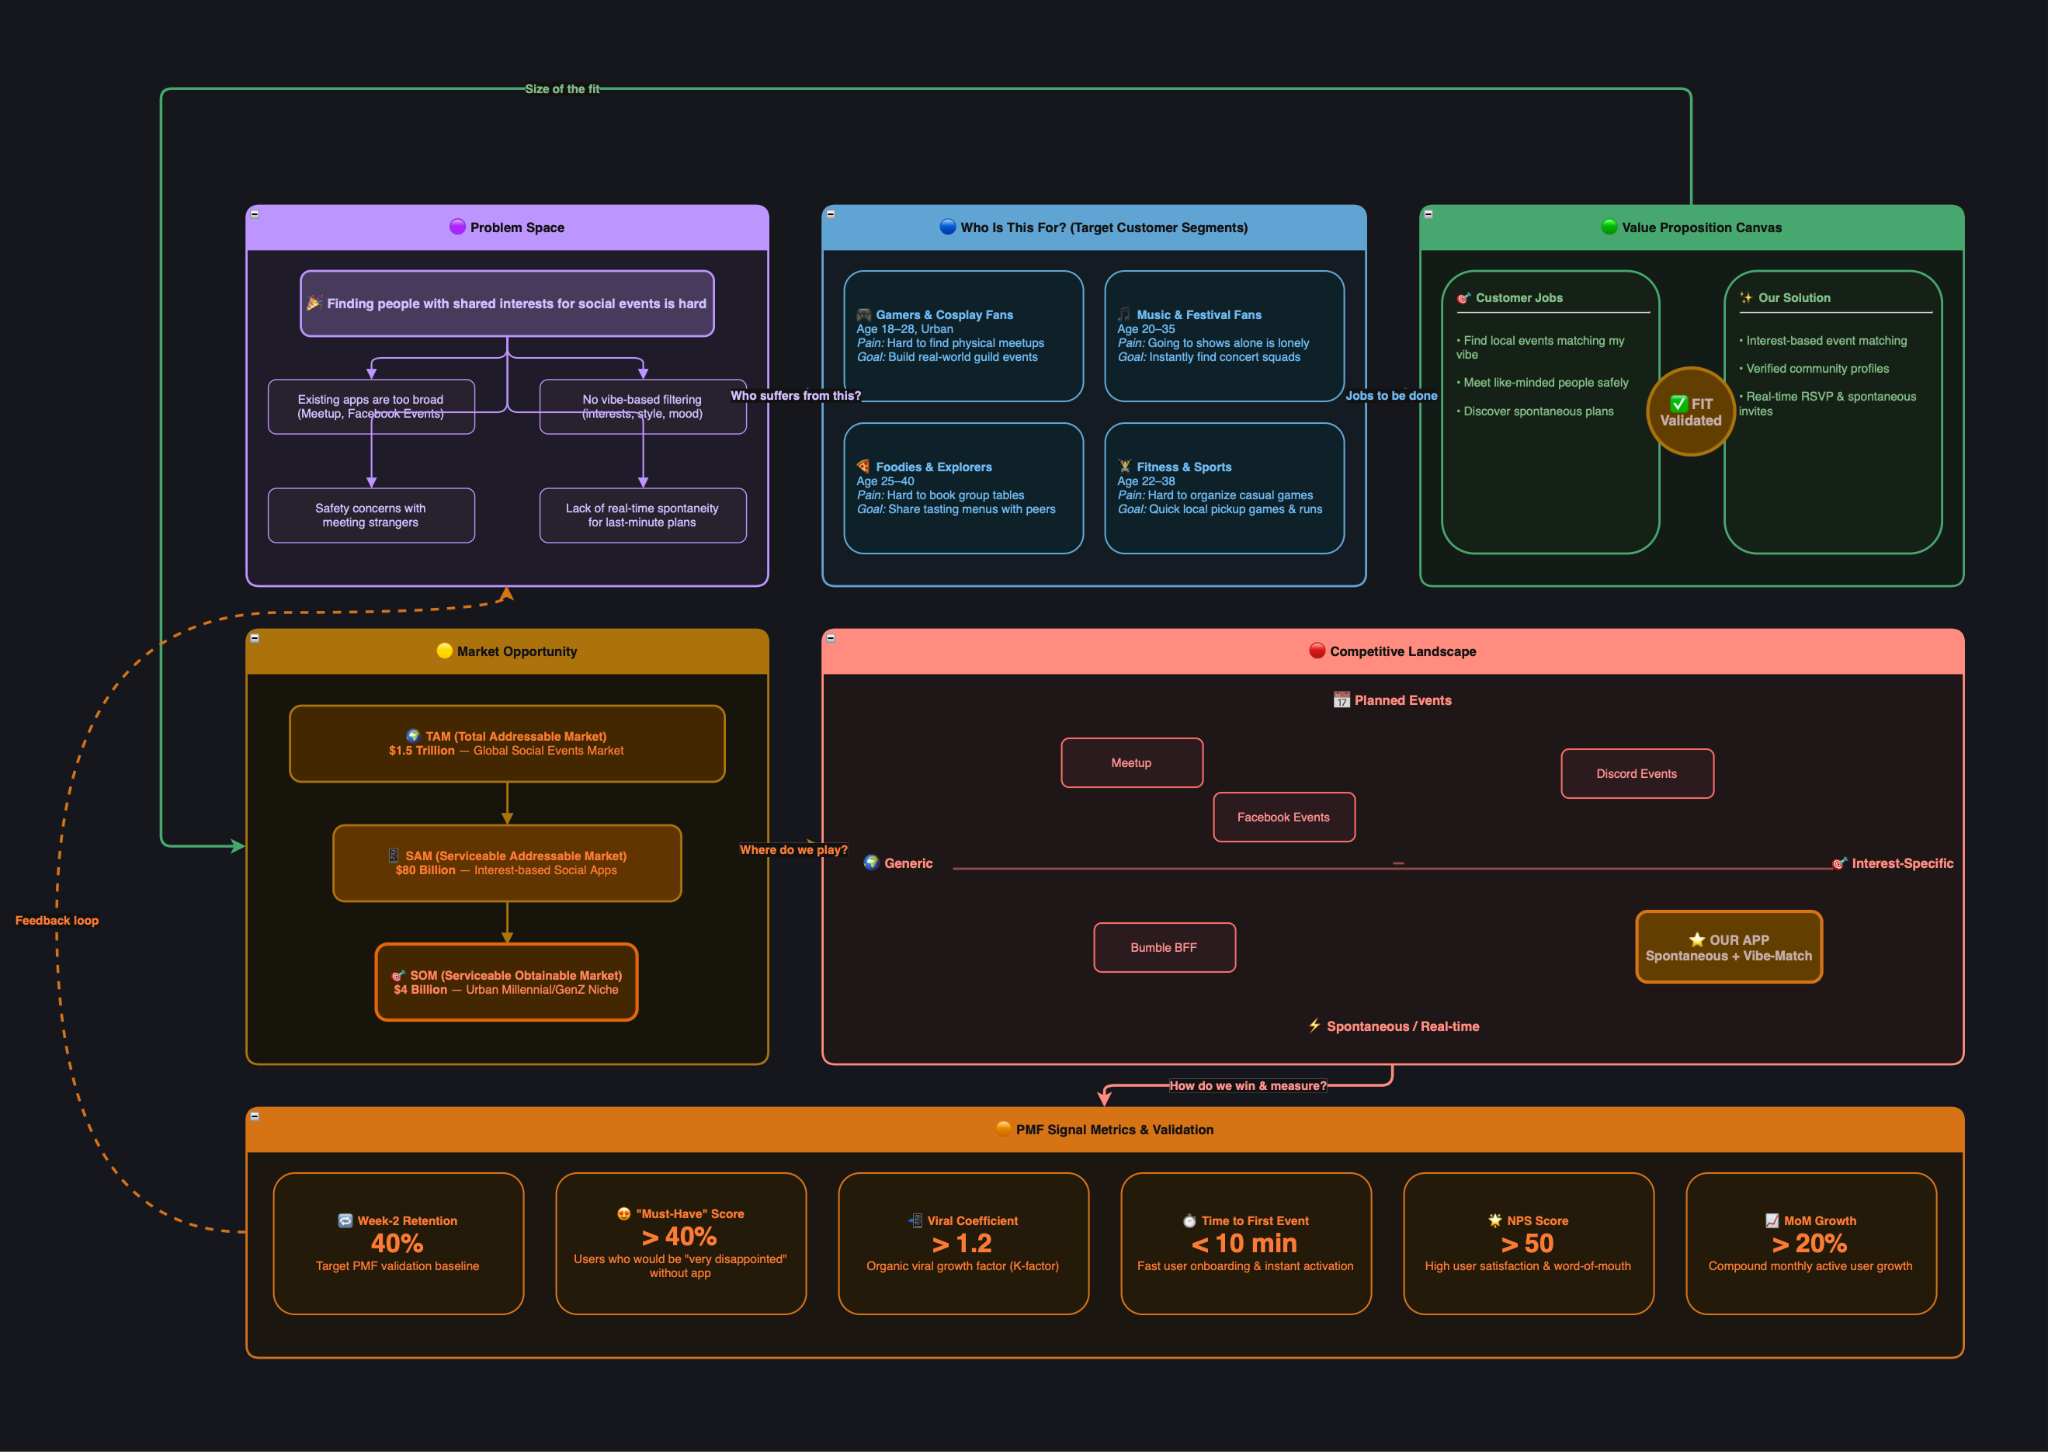
Real-World Use Cases
1. Product Manager: Feature Spec. to Diagram
A product manager needs to explain a new feature to engineering. They paste a plain English paragraph into Draw.io, click generate, and land on a clean flowchart within seconds. The diagram goes straight into the PRD so everyone sees the same process without a 20-minute walkthrough.
2. DevOps Engineer: Deployment Pipeline Documentation
A DevOps engineer wants to document a deployment pipeline. They sketch the flow in Draw.io then embed the iframe in the runbook. On-call engineers now see the latest steps at a glance.
3. Support Lead: Customer Escalation Mapping
A support lead maps a customer escalation path. They start with the edge cases in a mind map then lay the path over a flowchart. The combined view stays in the team’s internal docs so new hires learn the process in one place instead of three different documents.
Conclusion
Flowcharts turn plain English into visual clarity. Use these charts whenever your audience needs to understand a process faster than reading a paragraph. They basically turn “let me explain” into “here, look.”
Try it yourself: pick one process you explain repeatedly at work and turn it into a flowchart with Draw.io + Antigravity. Share what you build.